Which States Carry the Greatest Military Burden?
At the height of the Vietnam War in 1968, a year that saw President Lyndon Johnson raise troop levels in East Asia to nearly 550,000, the total number of active-duty American servicemembers was more than 3.5 million.
Today, there are about 1.3 million active-duty members of the military, with the U.S. maintaining a global military presence across approximately 750 bases in 80 countries — but, of course, our country isn’t technically in the midst of a foreign ground war. That’s not to say that American forces aren’t still engaged in operations worldwide. The U.S. military continues to conduct counter-terrorism operations in multiple regions, with servicemembers located in Eastern Europe, the Indo-Pacific, and Africa. The United States withdrew from the War in Afghanistan in 2021 after another 24 U.S. servicemembers were killed in 2020 and 2021.
As the U.S. population has continued to expand rapidly, the number of Americans bearing the burden of service to their country has fallen, concentrating the sacrifices of military life in fewer and fewer hands. About 2% of Americans in 1968 were serving in the military; today, that percentage is closer to 0.4%.
But military expenditures represent nearly $600 billion in the federal budget for 2019, and dozens of cities across the country rely on military bases and installations to support their economies. Every year national defense spending keeps increasing too, reaching nearly $860 billion in 2023. That led us to wonder which states seem to be carrying the largest load when it comes to military operations.
To understand that, we looked at data from the U.S. Department of Defense, the Defense Manpower Center, the National Archives and the U.S. Census Bureau. What we found was that not only has the burden of military service shrunk over time but there’s a great deal of variation across the country when it comes to current military service as well as deaths from past military action.
Current Military Members
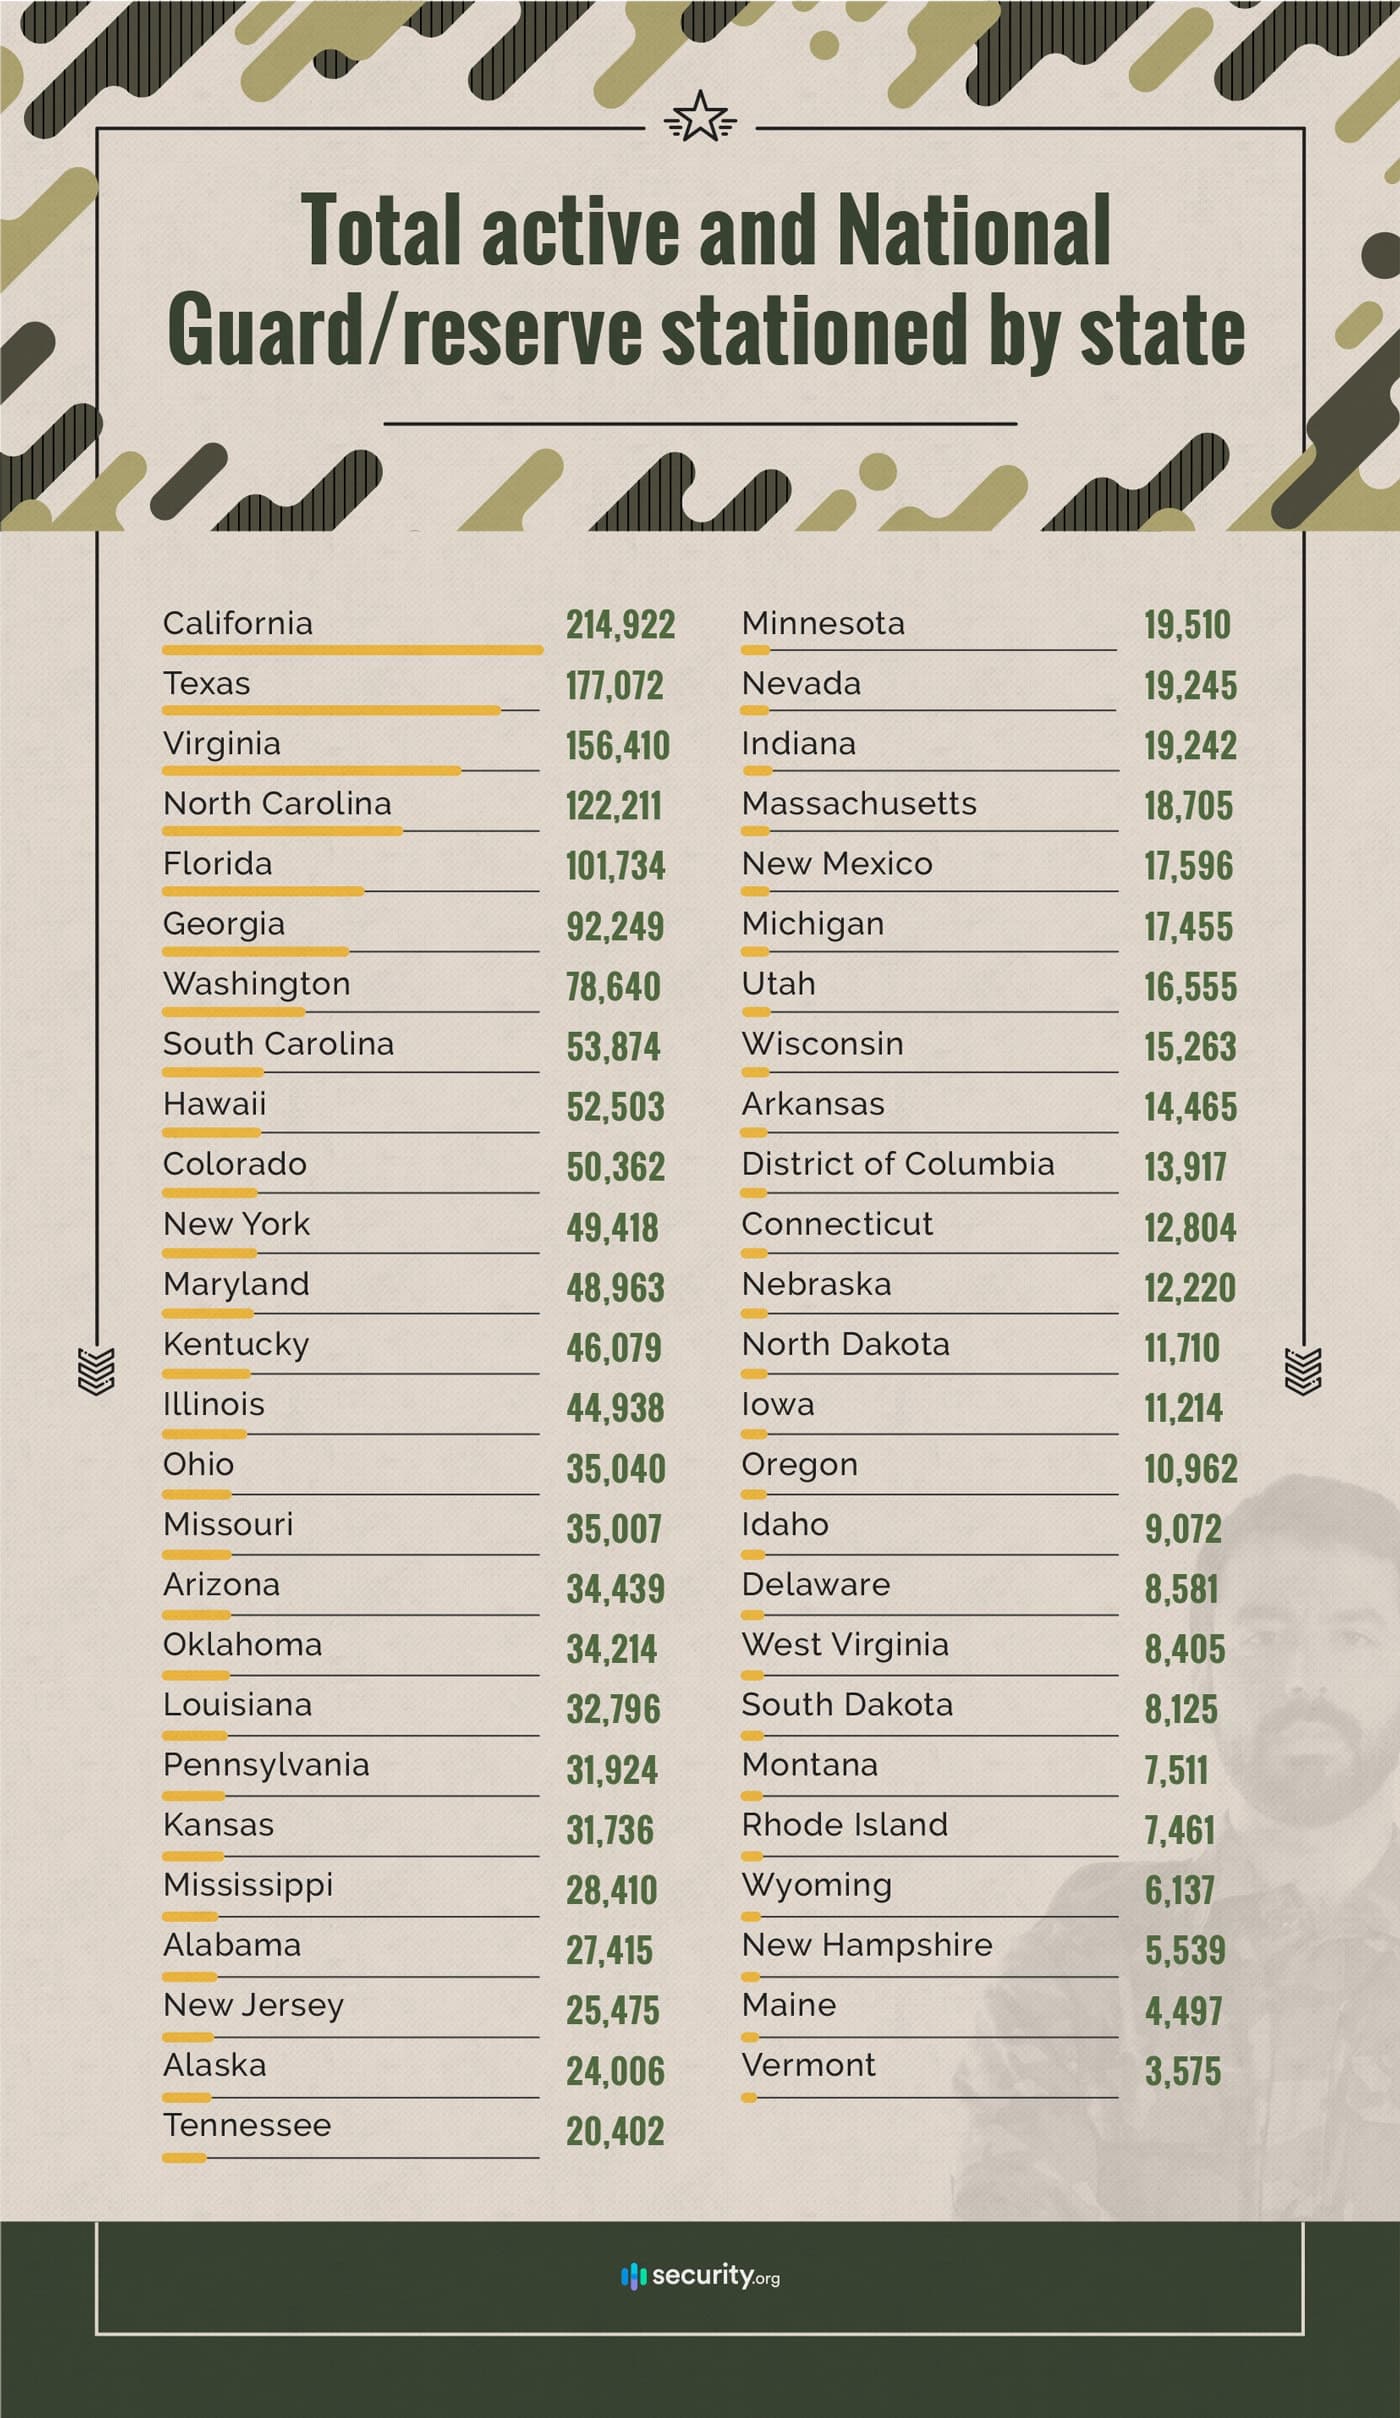
Today there are more than 2 million people listed as active-duty members of the U.S. military or the National Guard/military reserve, and only about 10% of them are stationed overseas. That means that the vast majority of American military service members are permanently assigned to jobs here in the United States. Looking to save on your home security system with your military status? Well, you’re in luck. SimpliSafe offers active-duty military members and veterans a discount. So, make sure you get the best deal by going through SimpliSafe’s deals and discounts.
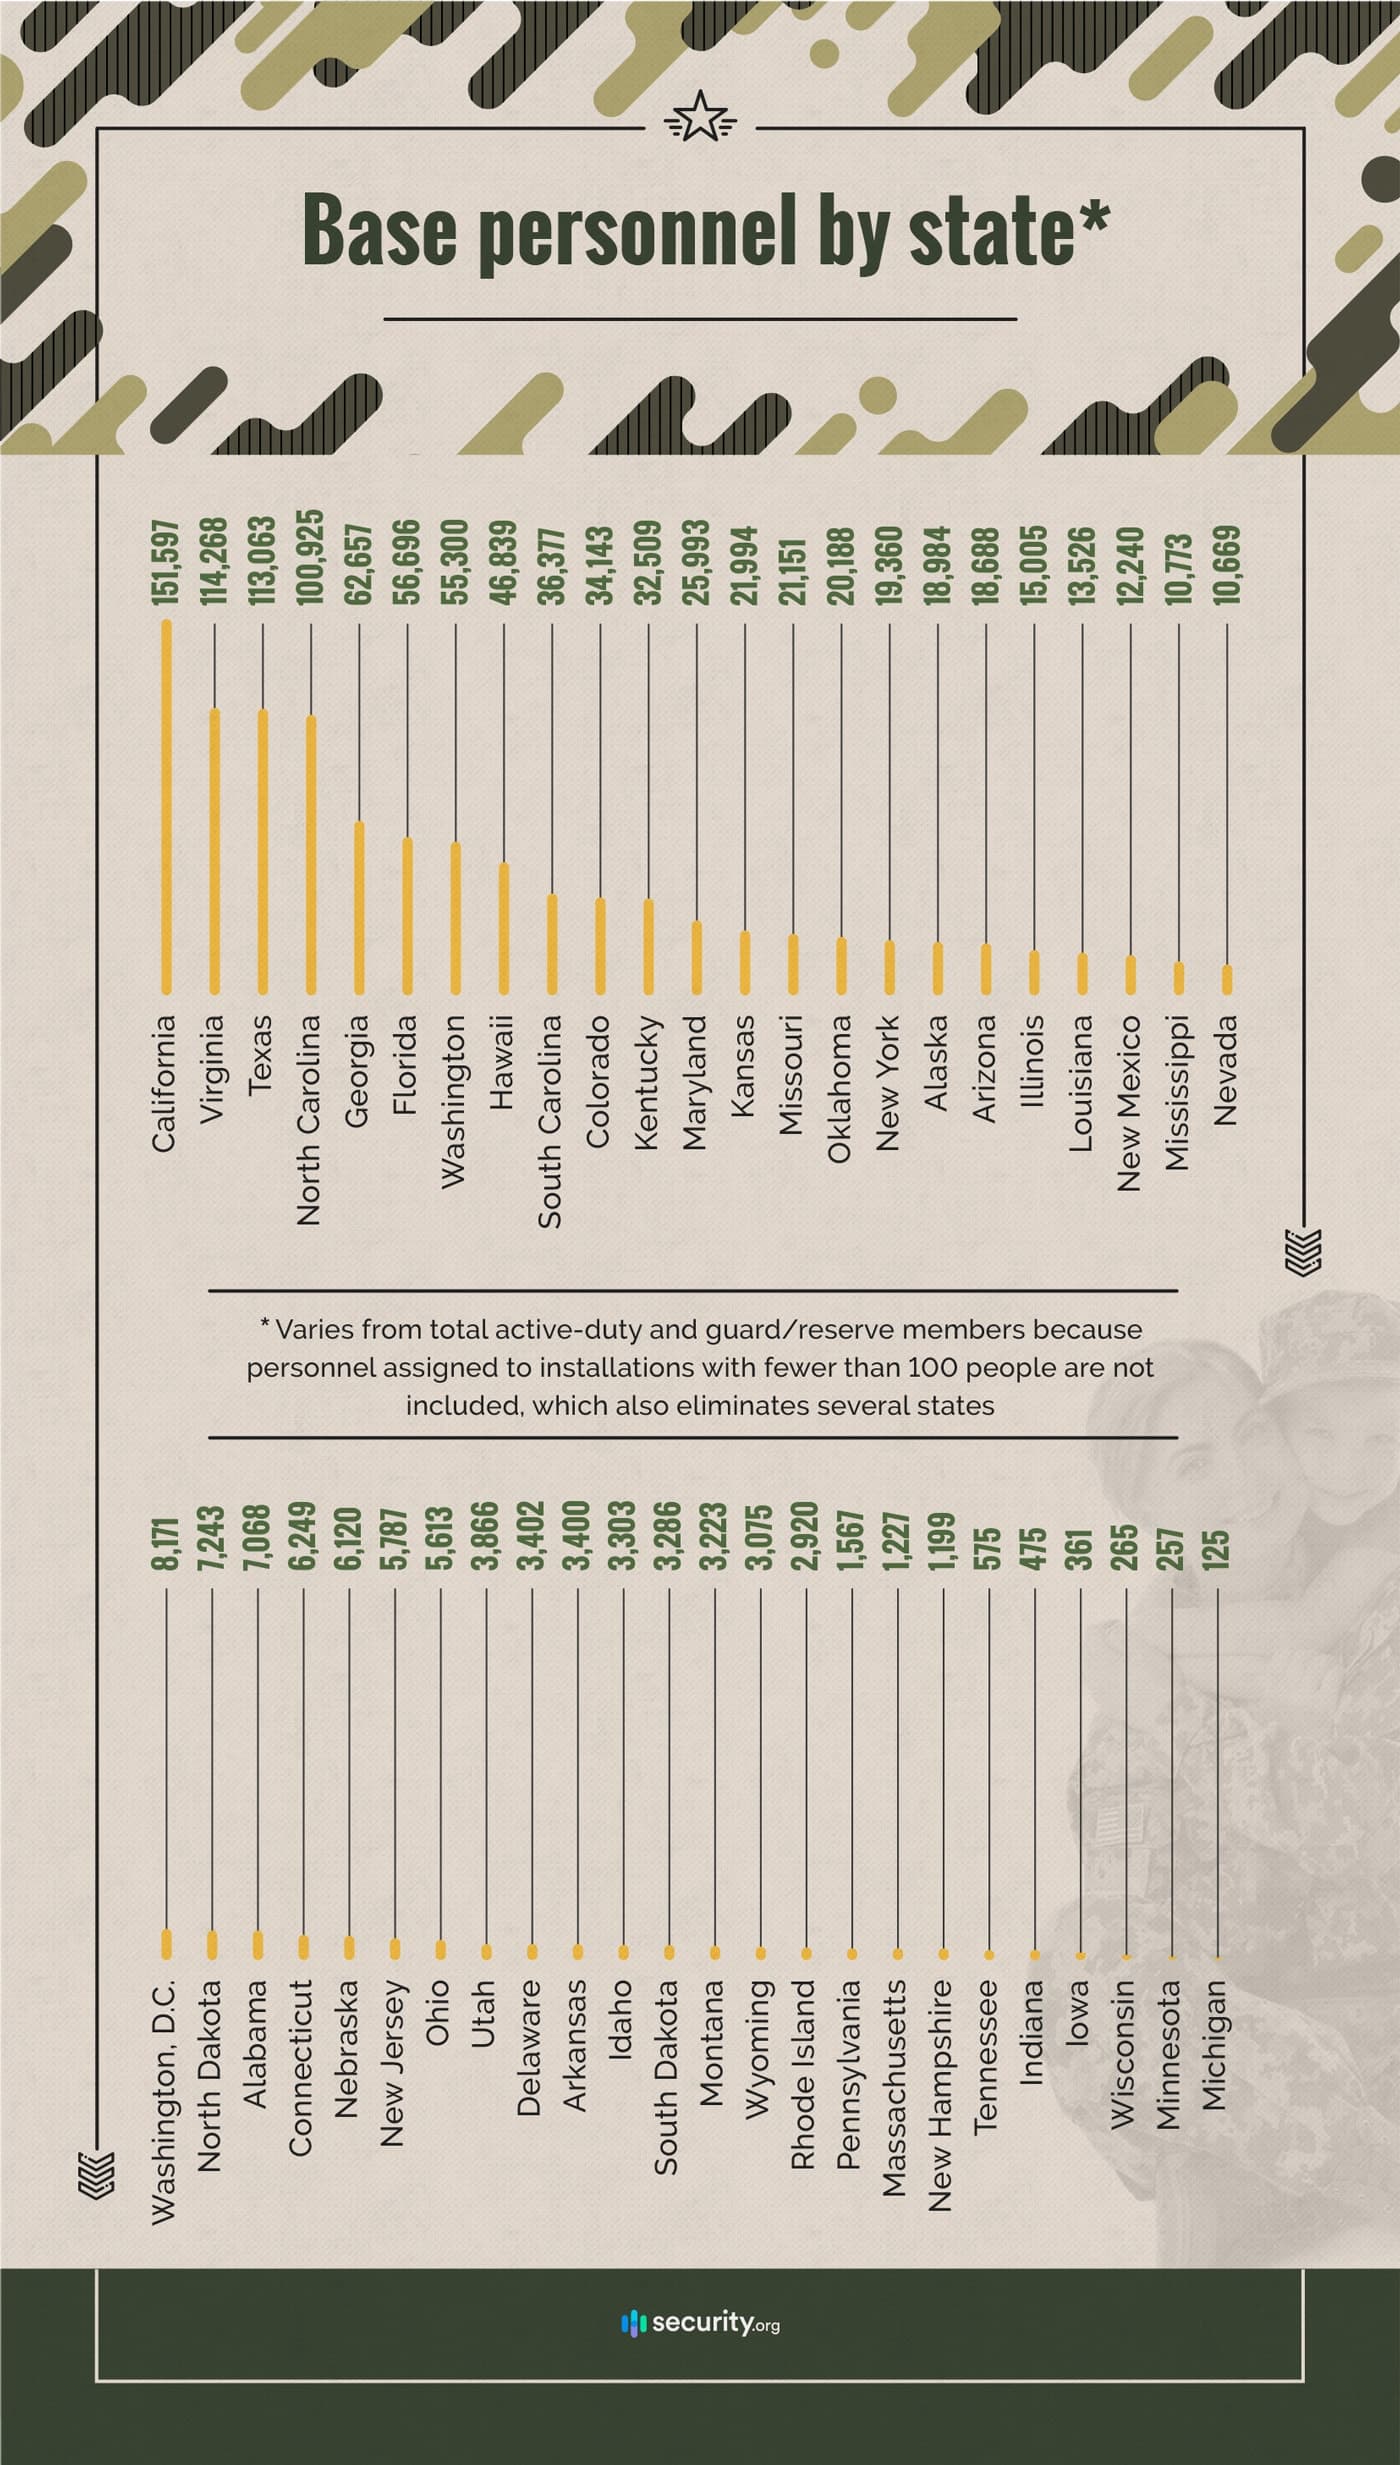
The distribution of service members by state reflects the location of major military installations. California, Texas, Virginia, and North Carolina remain the top four states for both military personnel stationed by state and base personnel assignments.
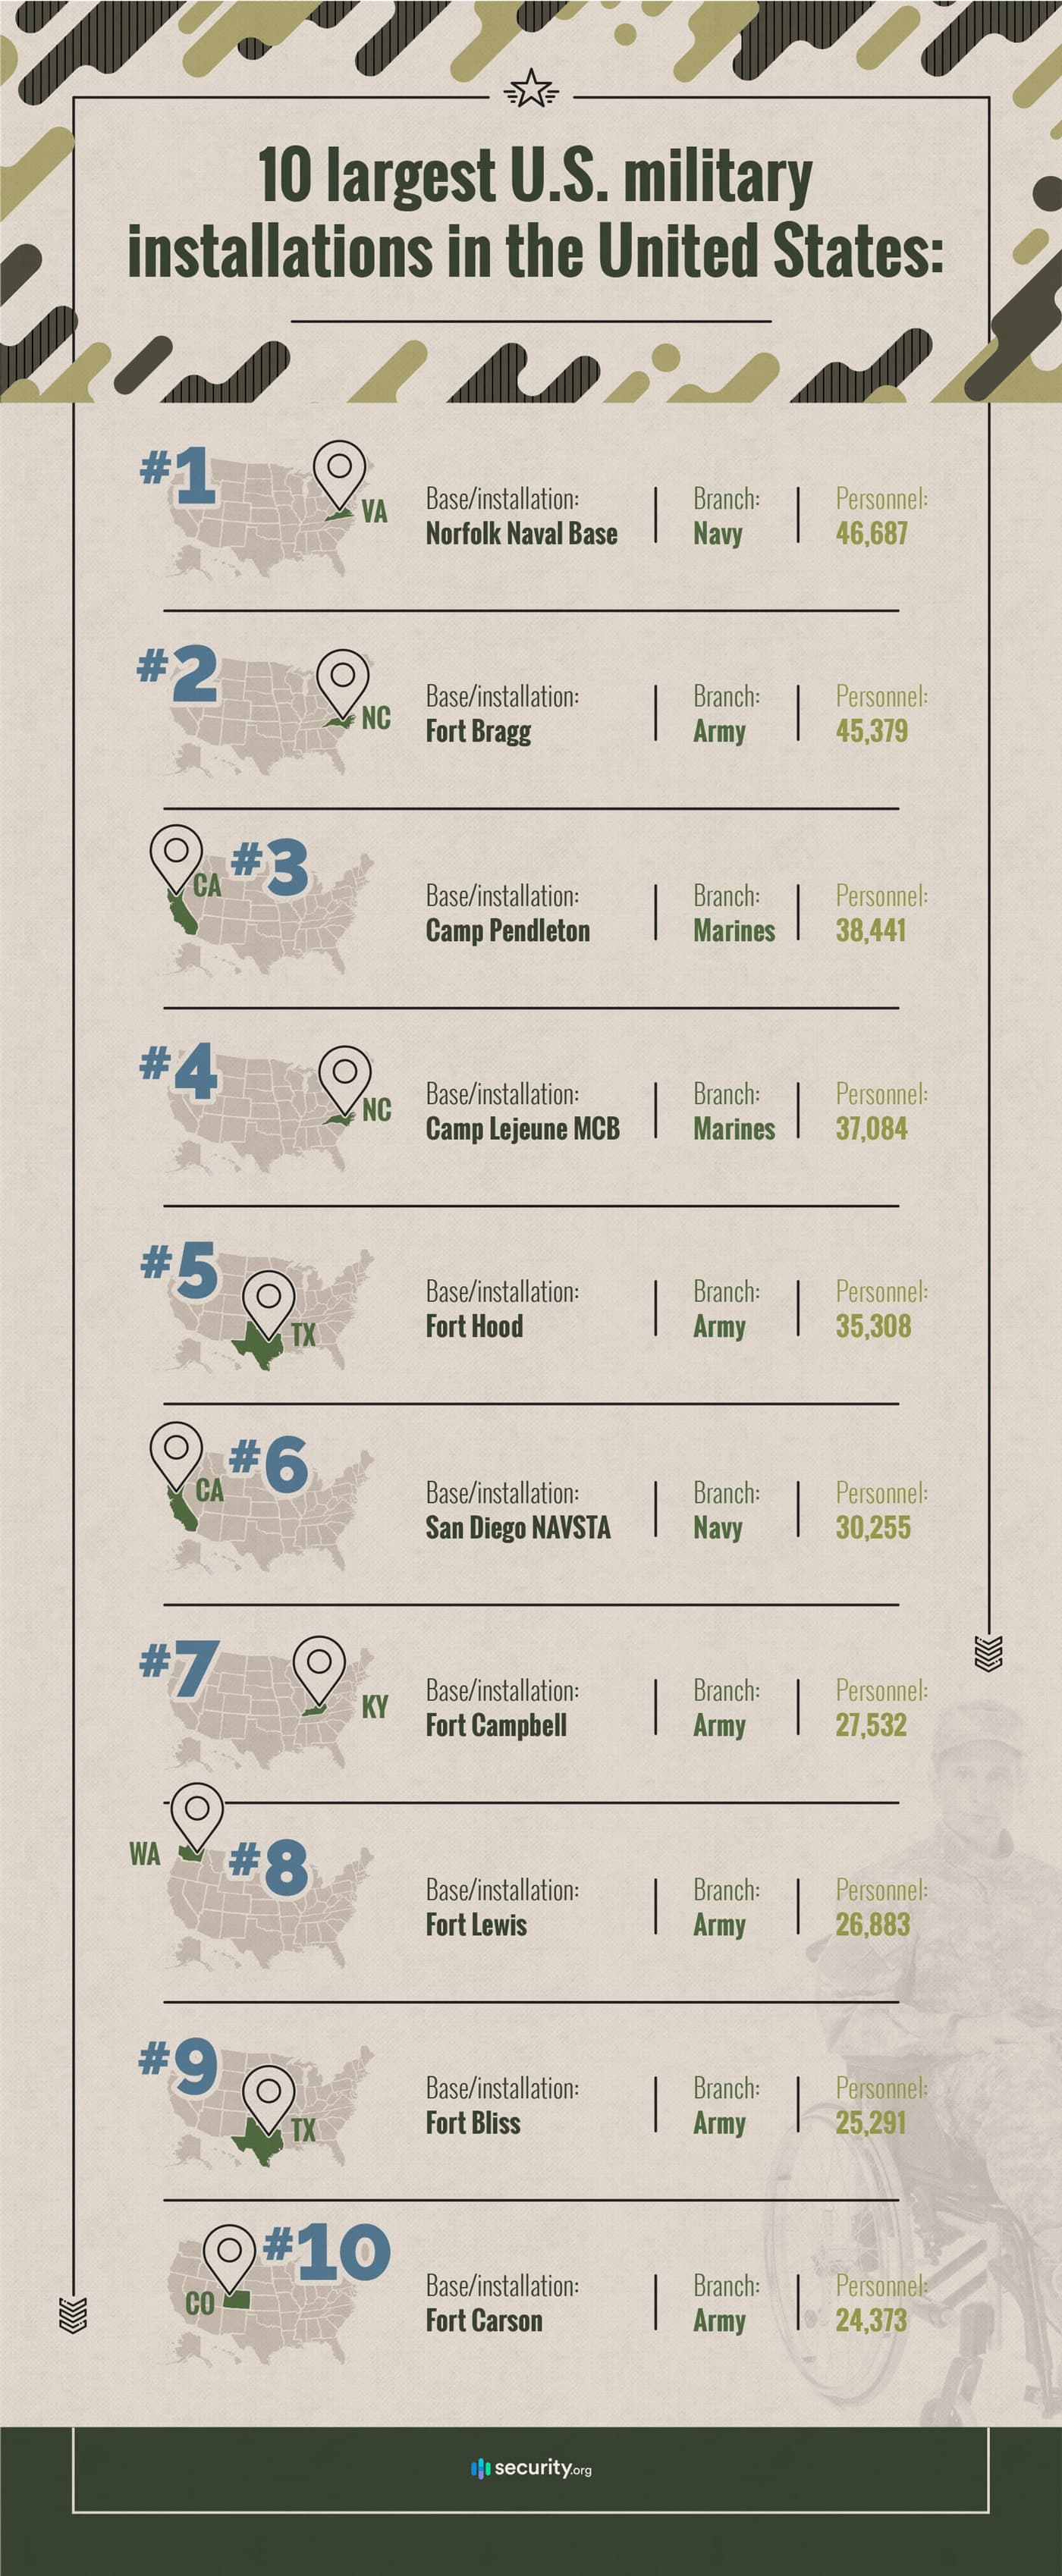
Comparing those two lists shows us that while every state is home to thousands of members of the military, just a few states are home to very large military installations. Here’s a look at the 10 largest U.S. military installations inside the United States:
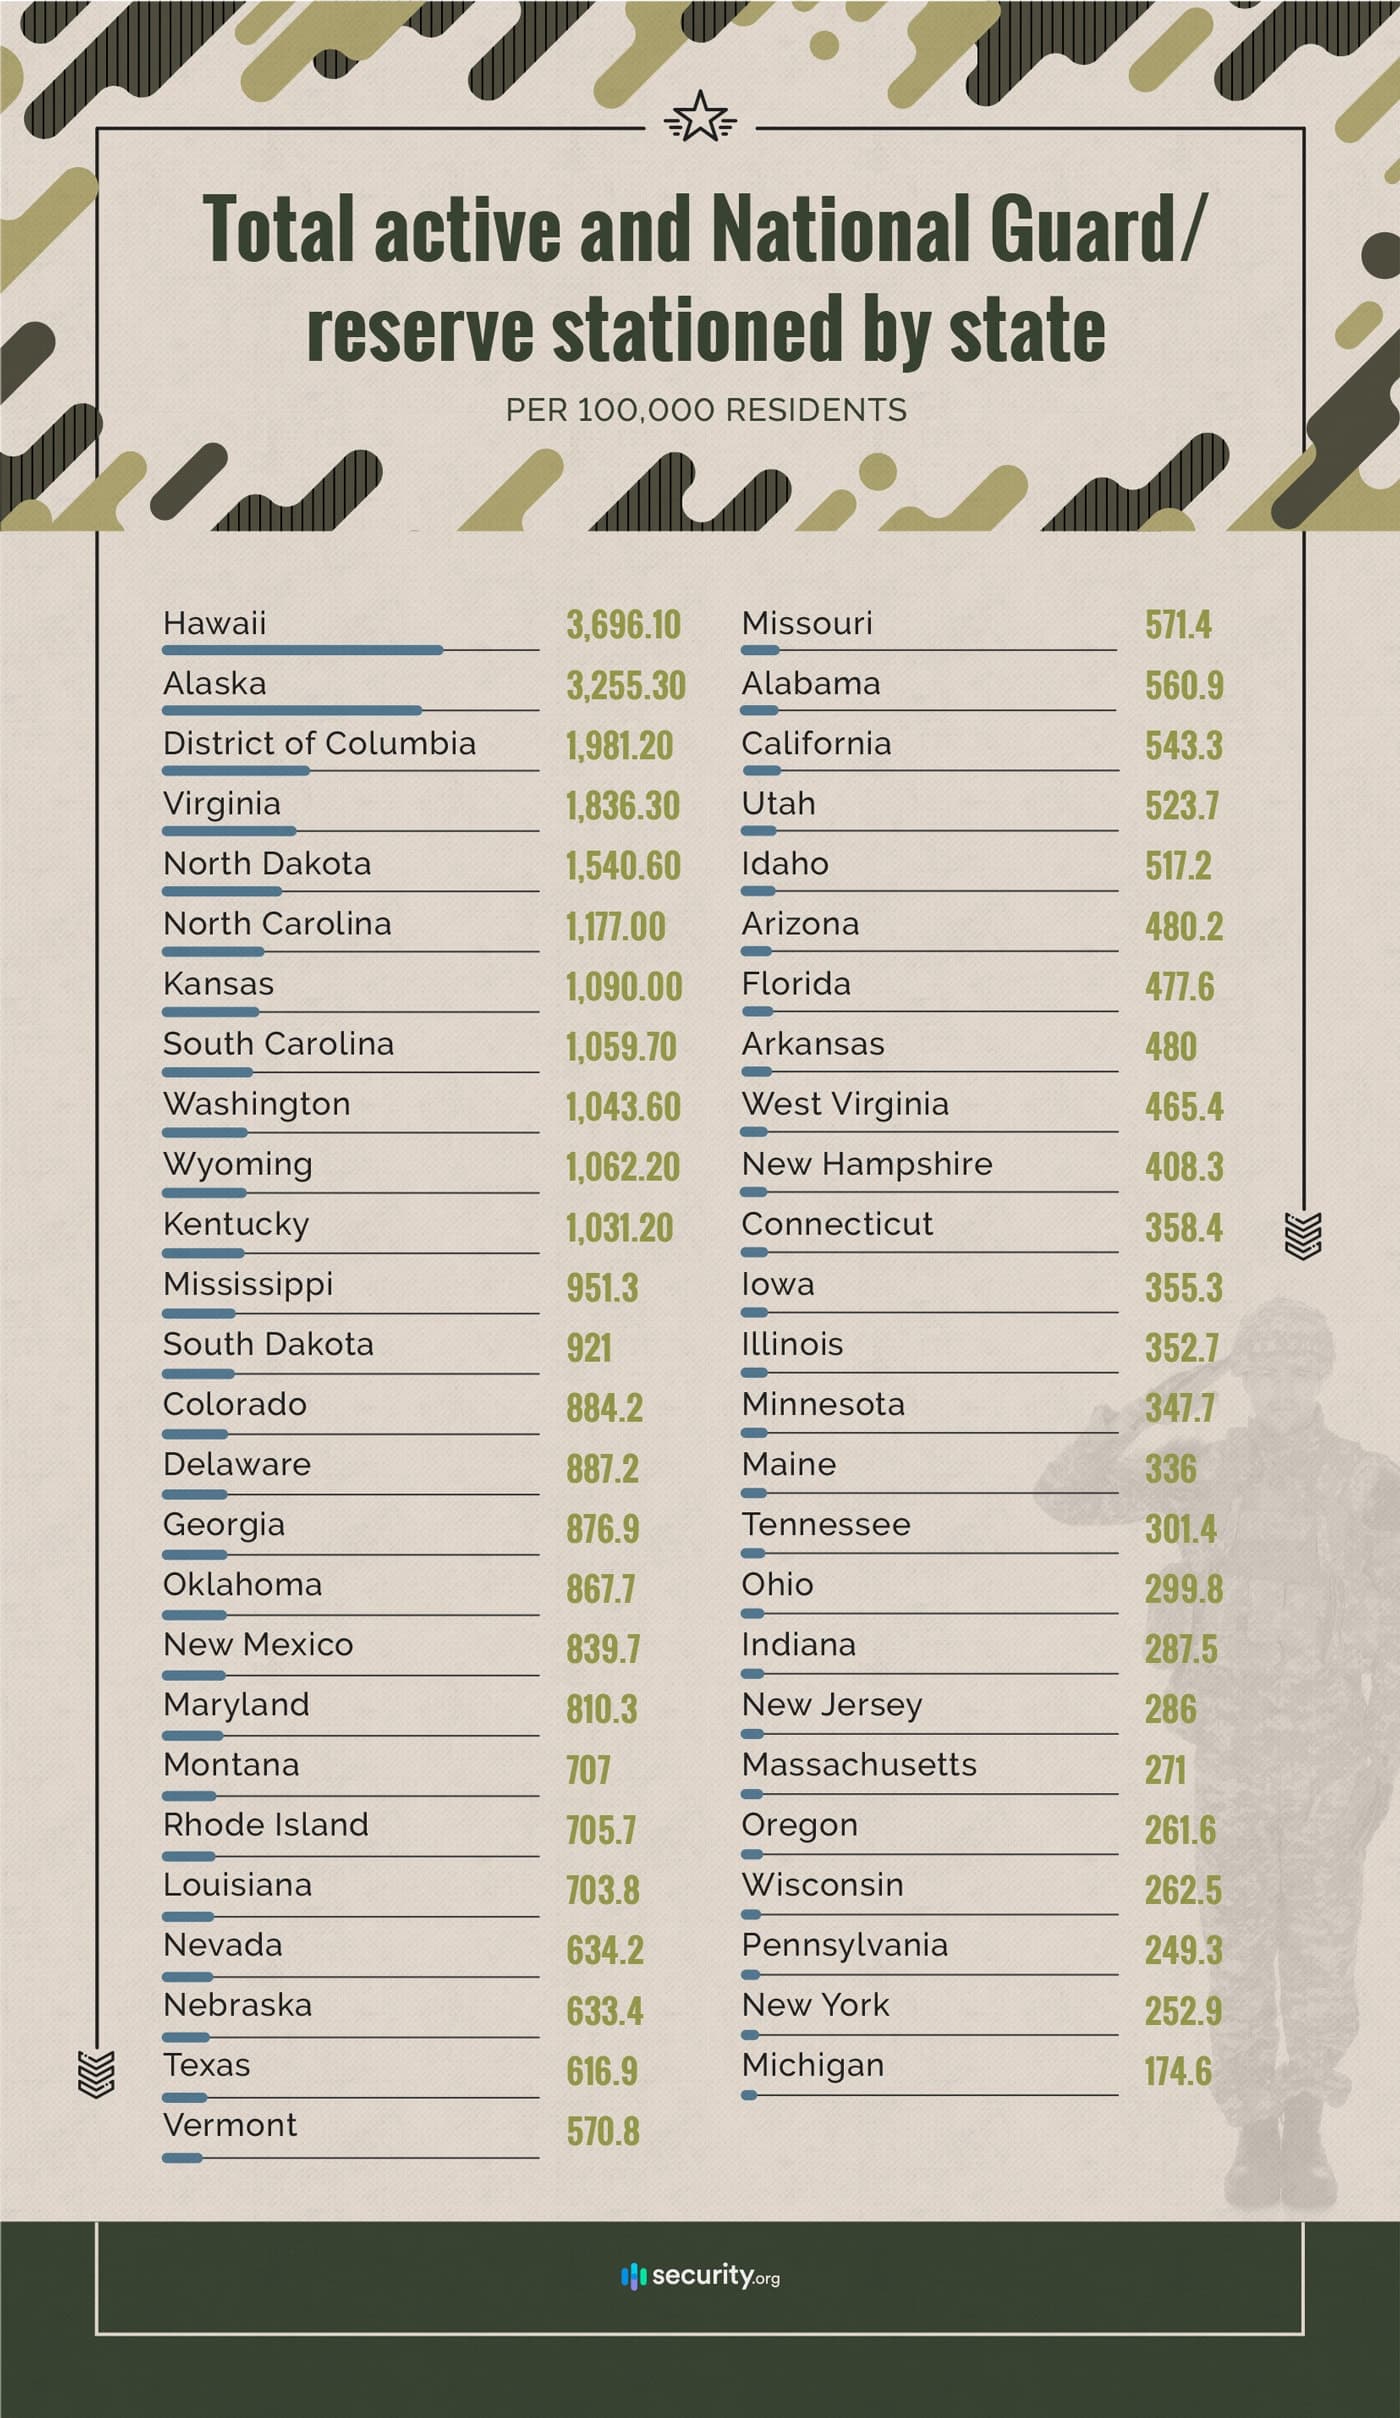
California and Texas are the two most populous U.S. states, so it’s perhaps no surprise that they have the first- and second-highest numbers of military members. But after adjusting for population, what changes do we see?
Hawaii and Alaska have the highest concentration of military service members per capita. This reflects both their strategic importance to Pacific defense and their relatively small civilian populations. California and Texas fall from No. 1 and No. 2 to No. 29 and No. 25, respectively. The District of Columbia, the nation’s capital, and Virginia, home to the country’s largest military installation, are Nos. 3 and 4, respectively.
The 10 states with the highest population-adjusted military service rates are geographically diverse, though the Northeast is the only region without a state in the top 10, and the South and West each have four.
Veteran Status
Current military service is important to understanding which states’ residents are most likely to feel the brunt of any new action by the American armed forces. But that tells only one part of the picture since millions of Americans are service veterans who are no longer in uniform.
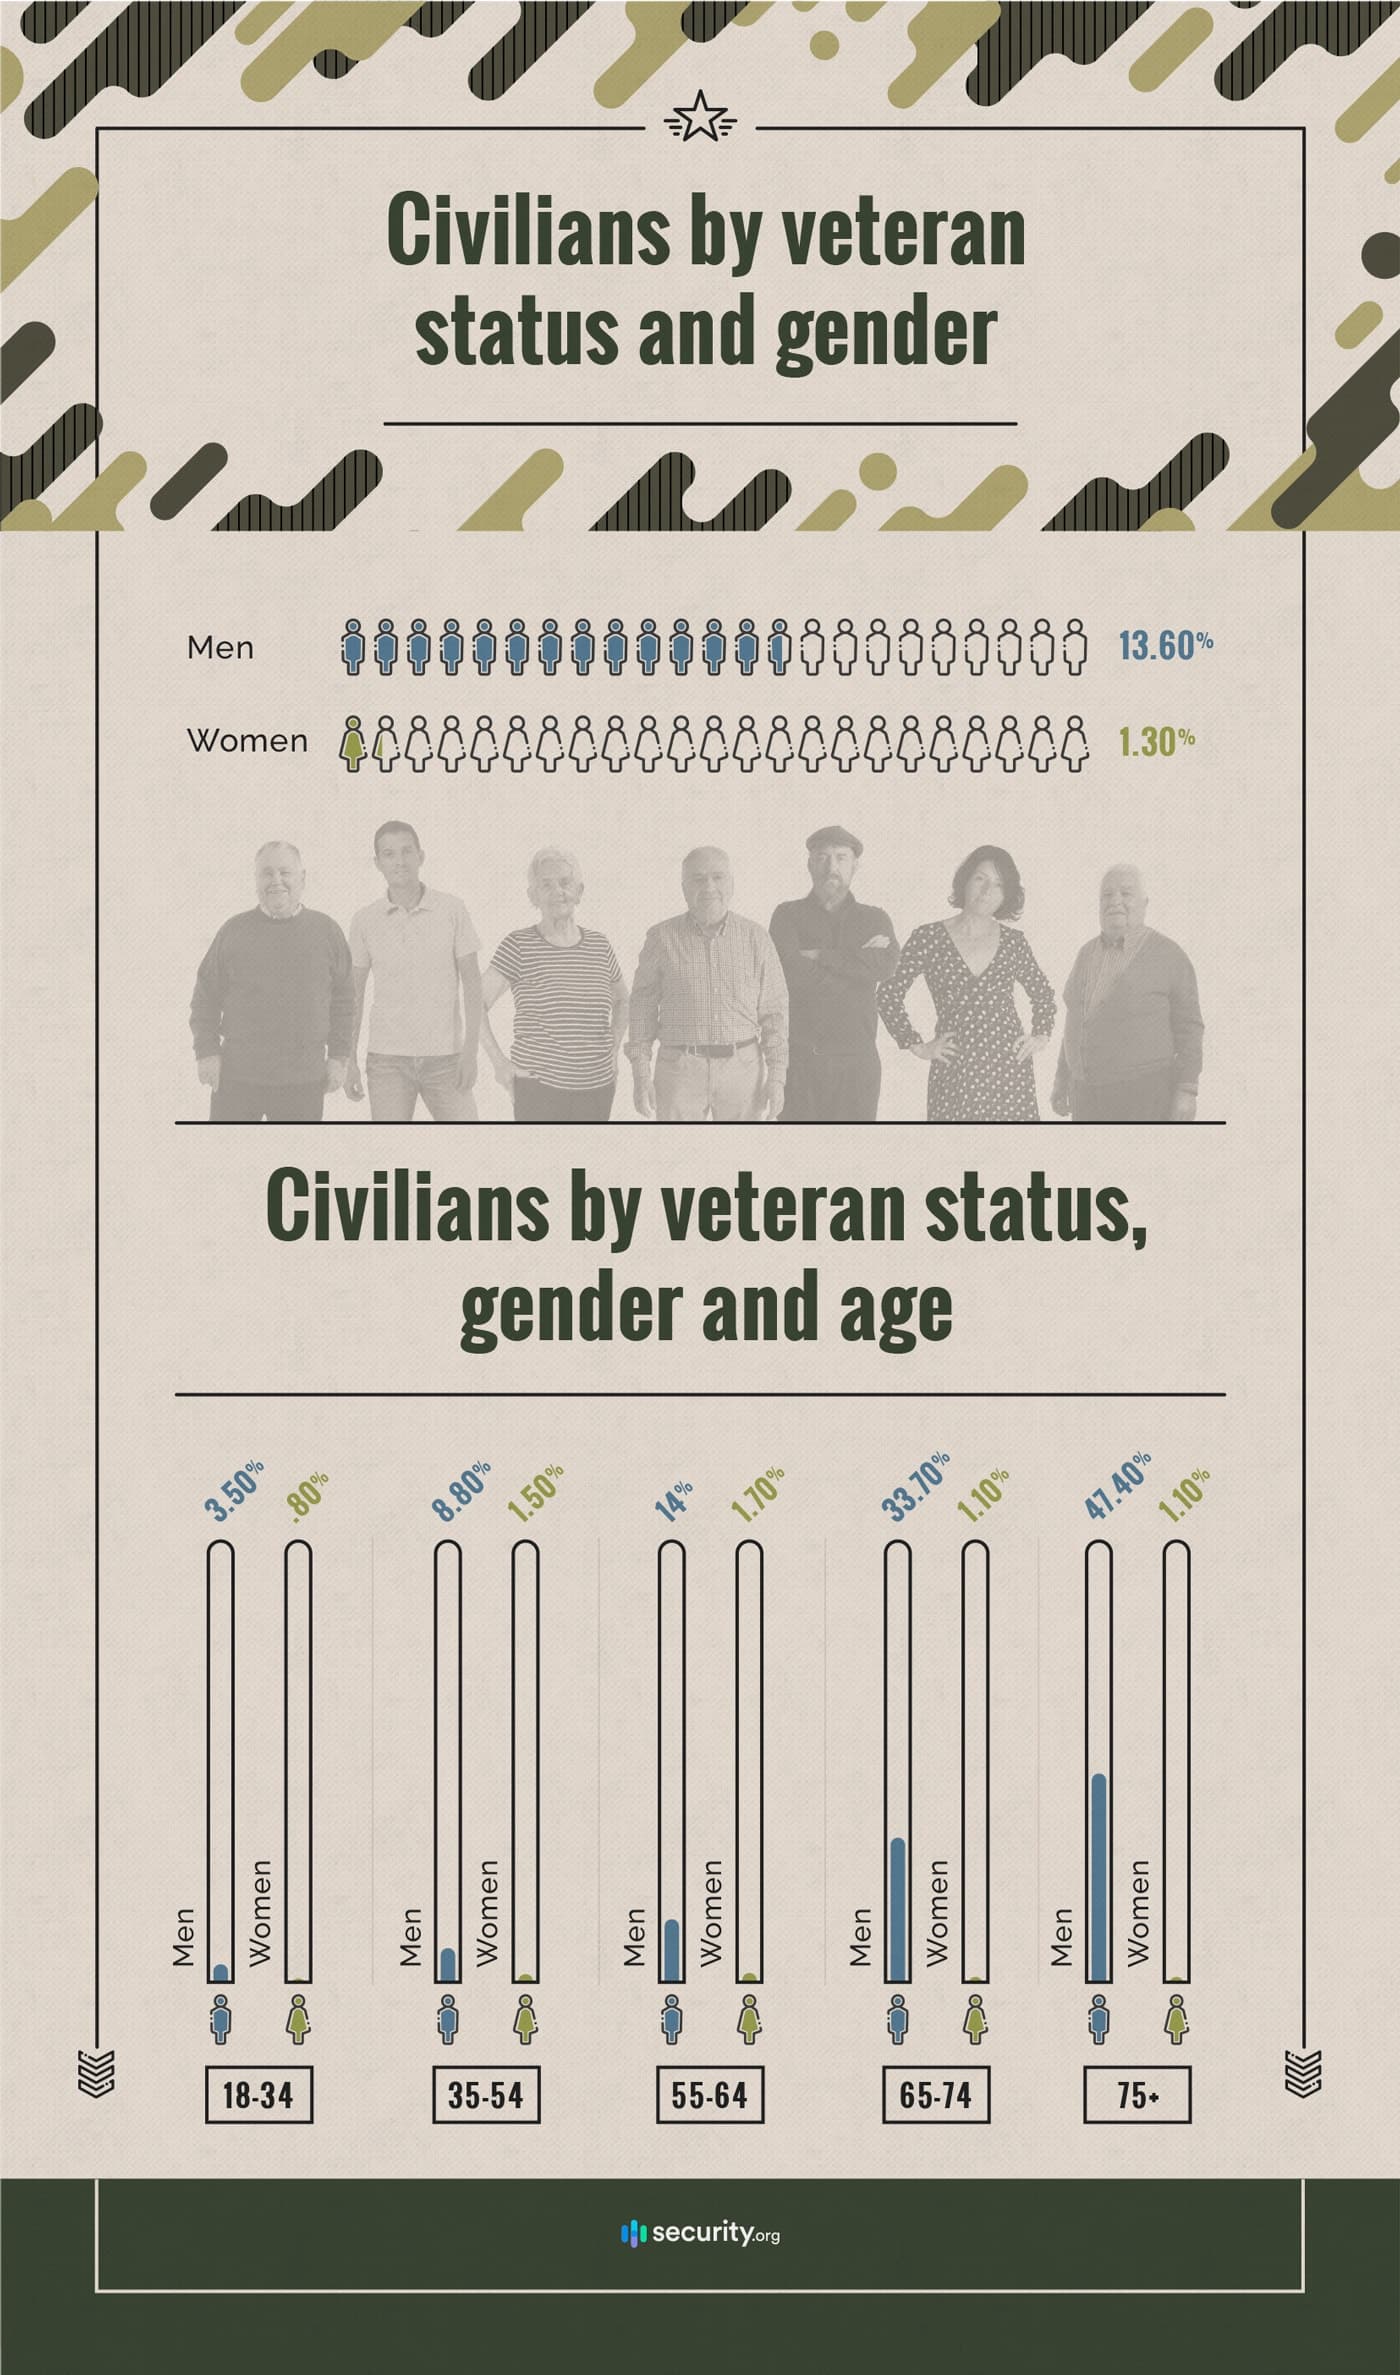
About six percent of Americans are military veterans, which is down from previous decades due to World War II and Korean War veterans passing away.1 This percentage is still high for older Americans as well as men.
The older the man, the more likely he is to be a military veteran, but for women, veteran status peaks for those between the ages of 55 and 64 and falls for women who are older than that. It’s important to note that these figures account for the civilian population, and women who are current military members are not counted, so we’d assume these figures will shift considerably in the future. In fact, the representation of women in the military has surged over the past several decades, rising by more than 240% since 1973. So the percentage of female veterans will continue rising.
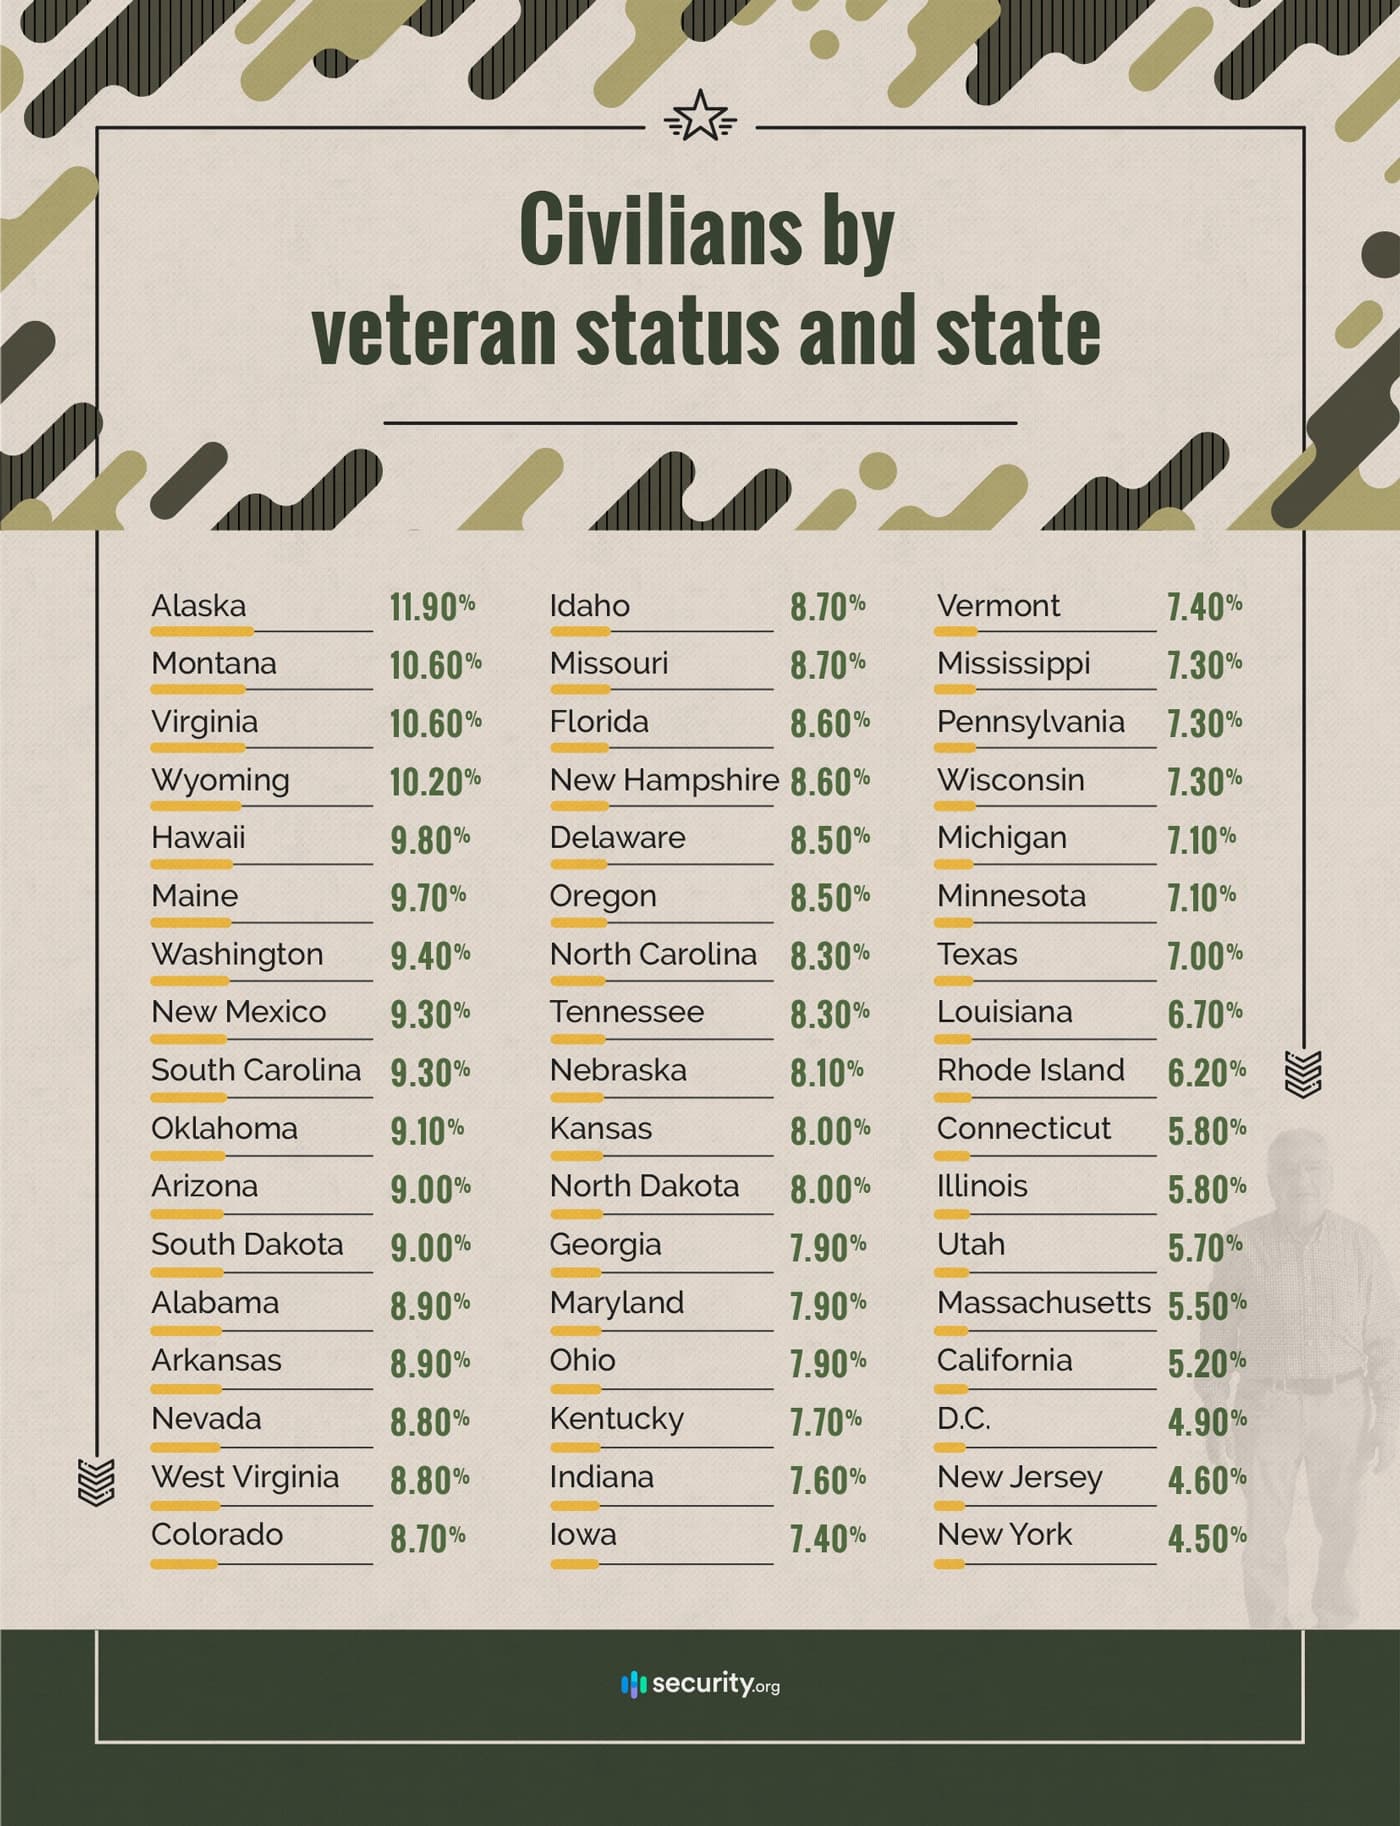
Which states have the highest percentage of civilians who are military veterans? A few of them should be familiar to us based on what we’ve already seen.
Alaska, which has the second-highest rate of military personnel, has the highest percentage of residents who are military veterans, and Hawaii, which has the highest population-adjusted rate of military service, is No. 4 when it comes to residents who are vets. Interestingly, D.C., which has a high rate of residents currently serving in the military, has one of the lowest percentages of civilian veterans. Our research suggests that servicemembers stationed in the nation’s capital often relocate after completing their service. They might be returning to their home states or looking for opportunities elsewhere.
All Gave Some, Some Gave All
Though it, thankfully, doesn’t happen to huge numbers of military servicemembers today, the true measure of sacrifice for one’s country is giving your very life in its defense. Modern military personnel who face danger are primarily those deployed in various global operations. This can include counter-terrorism missions, peacekeeping operations, and strategic deterrence activities across multiple theaters. Now, the United States involvement in the Middle East generally falls under Operation Inherent Resolve.
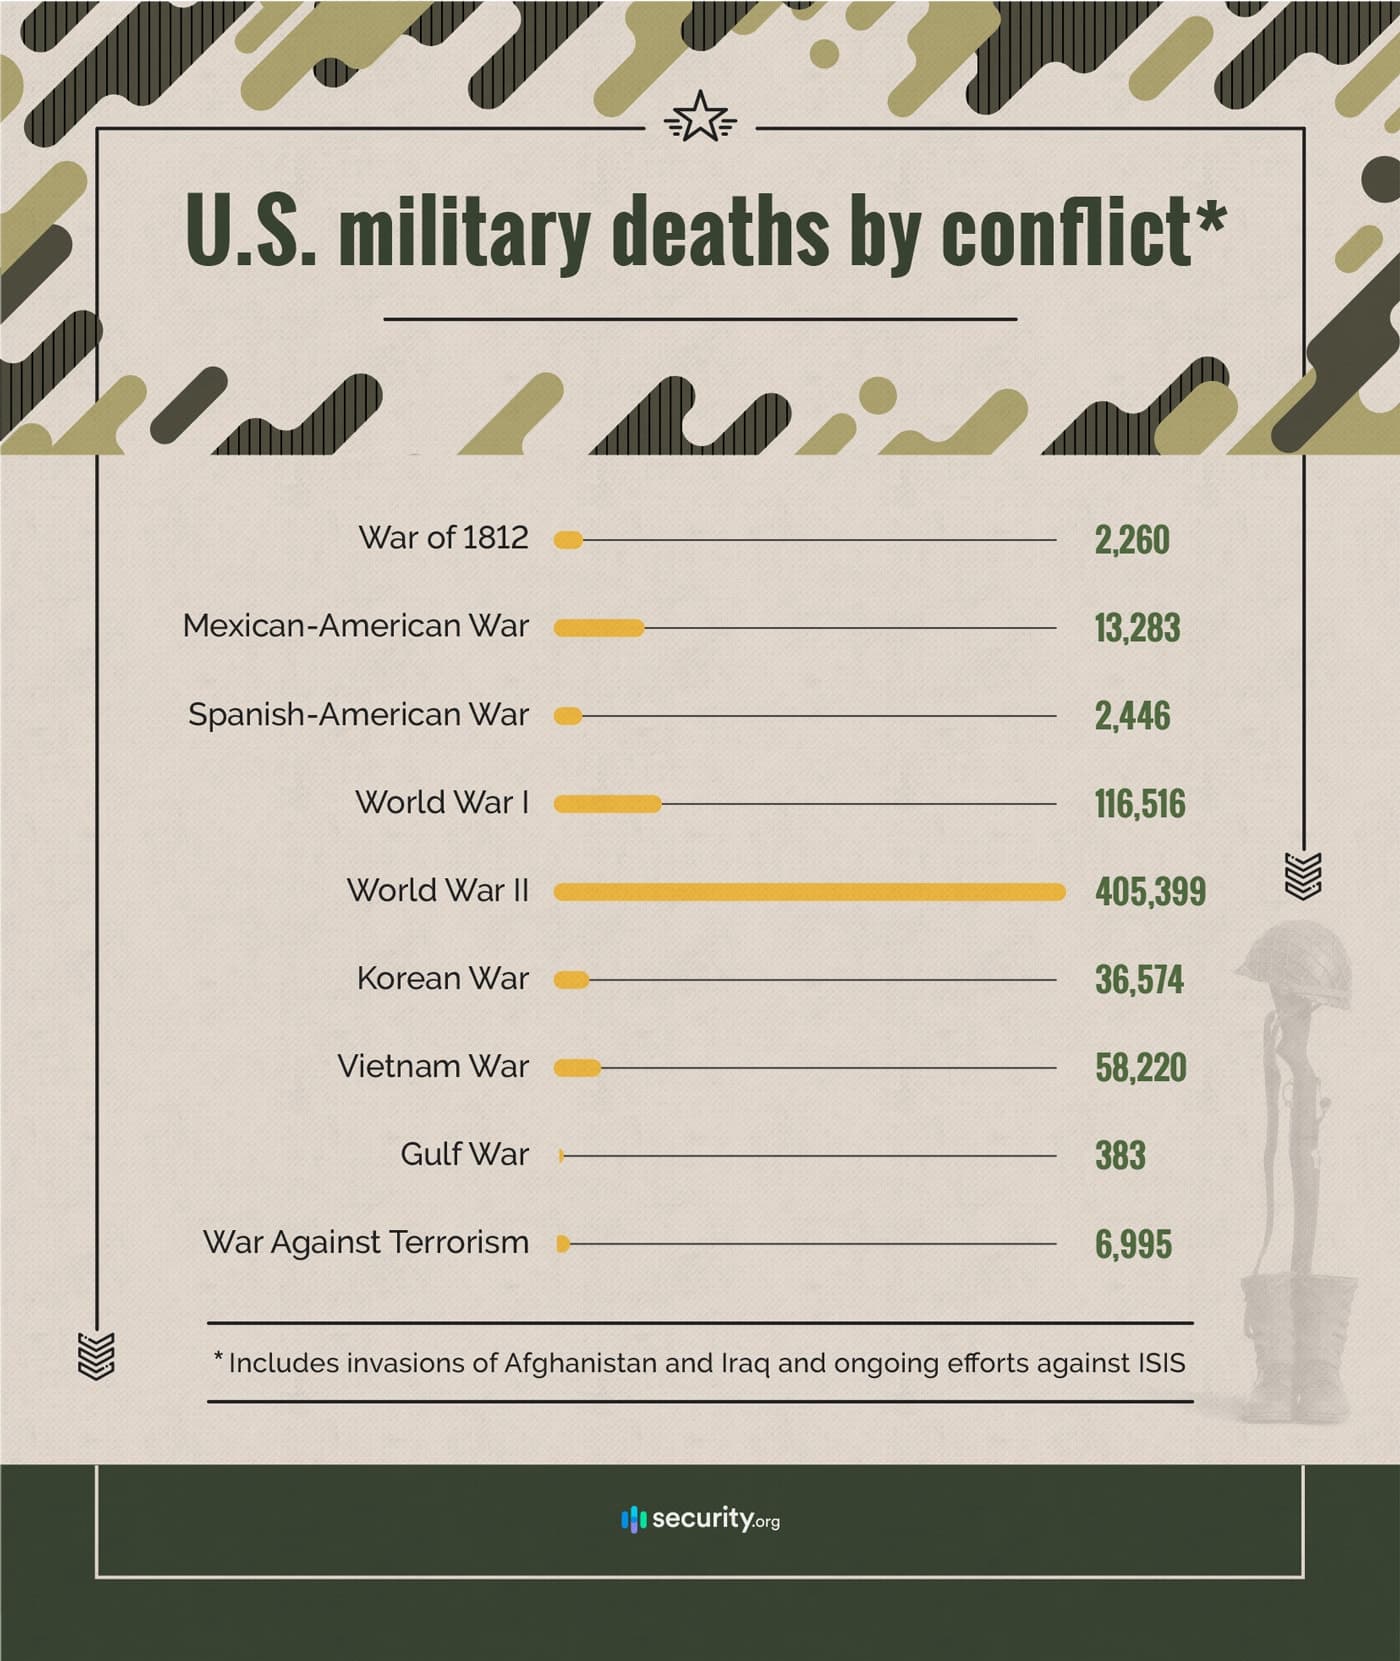
Fortunately for today’s servicemembers, modern conflicts are becoming less lethal due to advances in body armor, medical care, and evacuation procedures. Among all foreign conflicts after the American Revolution, World War II claimed by far the most American lives — more than 400,000 according to federal records.
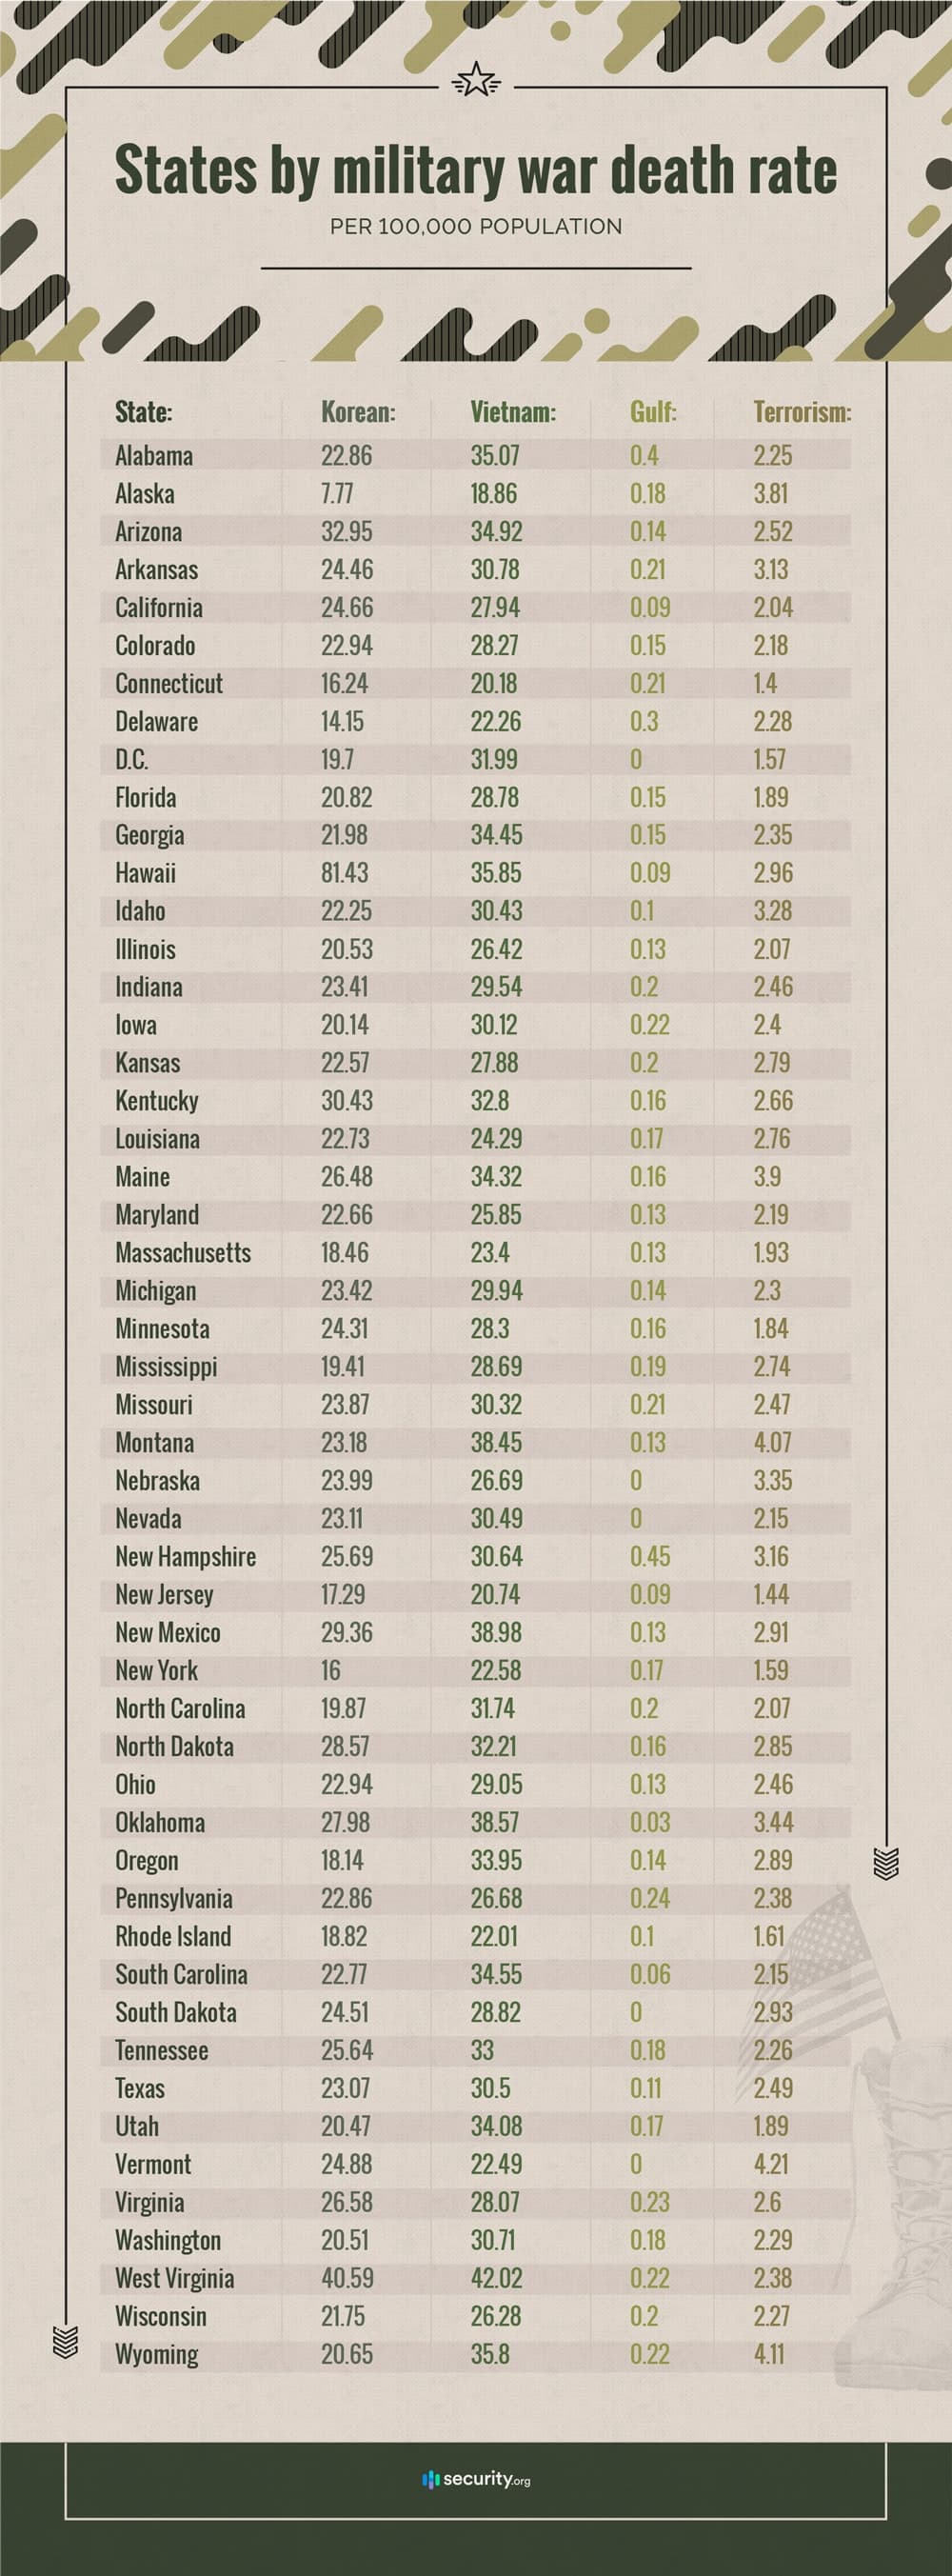
State-level data on wartime casualties is not available for conflicts before the Korean War, but among the conflicts for which we have data, for the vast majority of states, the Vietnam War was by far the most costly and the Gulf War, the least.
In just two states, Hawaii and Vermont, the population-adjusted military death rate for the Korean War exceeded that of the Vietnam War. In fact, Hawaii’s death rate for the Korean War, 81.43 per 100,000, is the single highest rate for any state in any of the conflicts for which the home states of those killed were available. Notably, the Korean War took place during a period before Hawaii was officially a state.
Our nation’s longest war in Afghanistan ended in 2021 after 20 years. However, American personnel continue to serve in various capacities throughout the world to support global security operations. Recent polling shows that a majority of Americans don’t believe were worth fighting: 62% of adults (and 64% of veterans) say the Iraq War was not worth the sacrifice, and 59% of adults (and 58% of veterans) say the same about the war in Afghanistan.
Conclusion
Military service remains one of the most demanding and dangerous. Today’s all-volunteer force means that less than one percent of Americans shoulder the responsibility of serving their country. As military families often pass down traditions of service from generation to generation, this burden becomes concentrated in specific communities and regions. Examining current service statistics as well as veteran status and wartime deaths clearly shows a huge imbalance when it comes to which states bear the burden of serving their country.
About This Story
All of our information about current military service and military wartime deaths came from the U.S. Department of Defense, sub-agencies or contractors. Here’s a detailed look:
Current personnel: Information on active and reserve military personnel stationed in each state and most countries (Iraq and Afghanistan totals are not public) can be found in quarterly reports published by the Defense Manpower Data Center, a division of the DoD. We used the June 2019 report, and you can see that and others here.
Base population: Information on personnel stationed at each major U.S. military installation came from a report published by Military One Source, a DoD contractor. The most recent available report is from 2017.
Population-adjusted military personnel rates: This information was calculated using the current personnel figures from the DoD and state populations from the U.S. Census Bureau.
Military demographics: Data on the representation of women in the military came from a 2017 report published by the DMDC.
Veteran status: The percentage of civilians in each state who are veterans came from a U.S. Census table.
Military wartime deaths: Information on the number of deaths per conflict and state came from an interactive database at the National Archives. We searched for military deaths in each conflict based on the reported home state of the deceased; that information was not available for each person. We used the totals for each state and conflict and created a population-adjusted death rate based on each state’s population during the conflict; for multi-year conflicts, we used the middle year of the conflict, with the exception of the War Against Terrorism for which we used current population figures.
Fair Use Statement
Feel free to use the information or images contained on this page, provided you included a link back to this URL.
Citations
- 1. United States Census Bureau. (2023). Veterans Day 2023: November 11.
https://www.census.gov/newsroom/facts-for-features/2023/veterans-day.html

